


This is a pilot of a more extensive 3-year study on how the process of recording and representing data using familiar, everyday materials can lead to long-term behaviour change in environmentally sustainable consumer practices. Built on the theory that data visualisations — when constructed using interactive, tactile, sonic, olfactory or edible materials — have the potential to enable reflection and change habits through physical, emotional, intellectual and social engagement, this study aimed to knock my own compulsive snacking behaviour on the head for a period of nine weeks.
This project tests the hypothesis that value of a physical data visualisation in encouraging sustainable behaviour (Vb) is determined by the sum of the uniqueness in its design (U), its ease of use or accessibility (A), its capacity for engagement in an affective, physical, intellectual and social sense (E) and the length of time in engaging with the physical visualisation (L) .
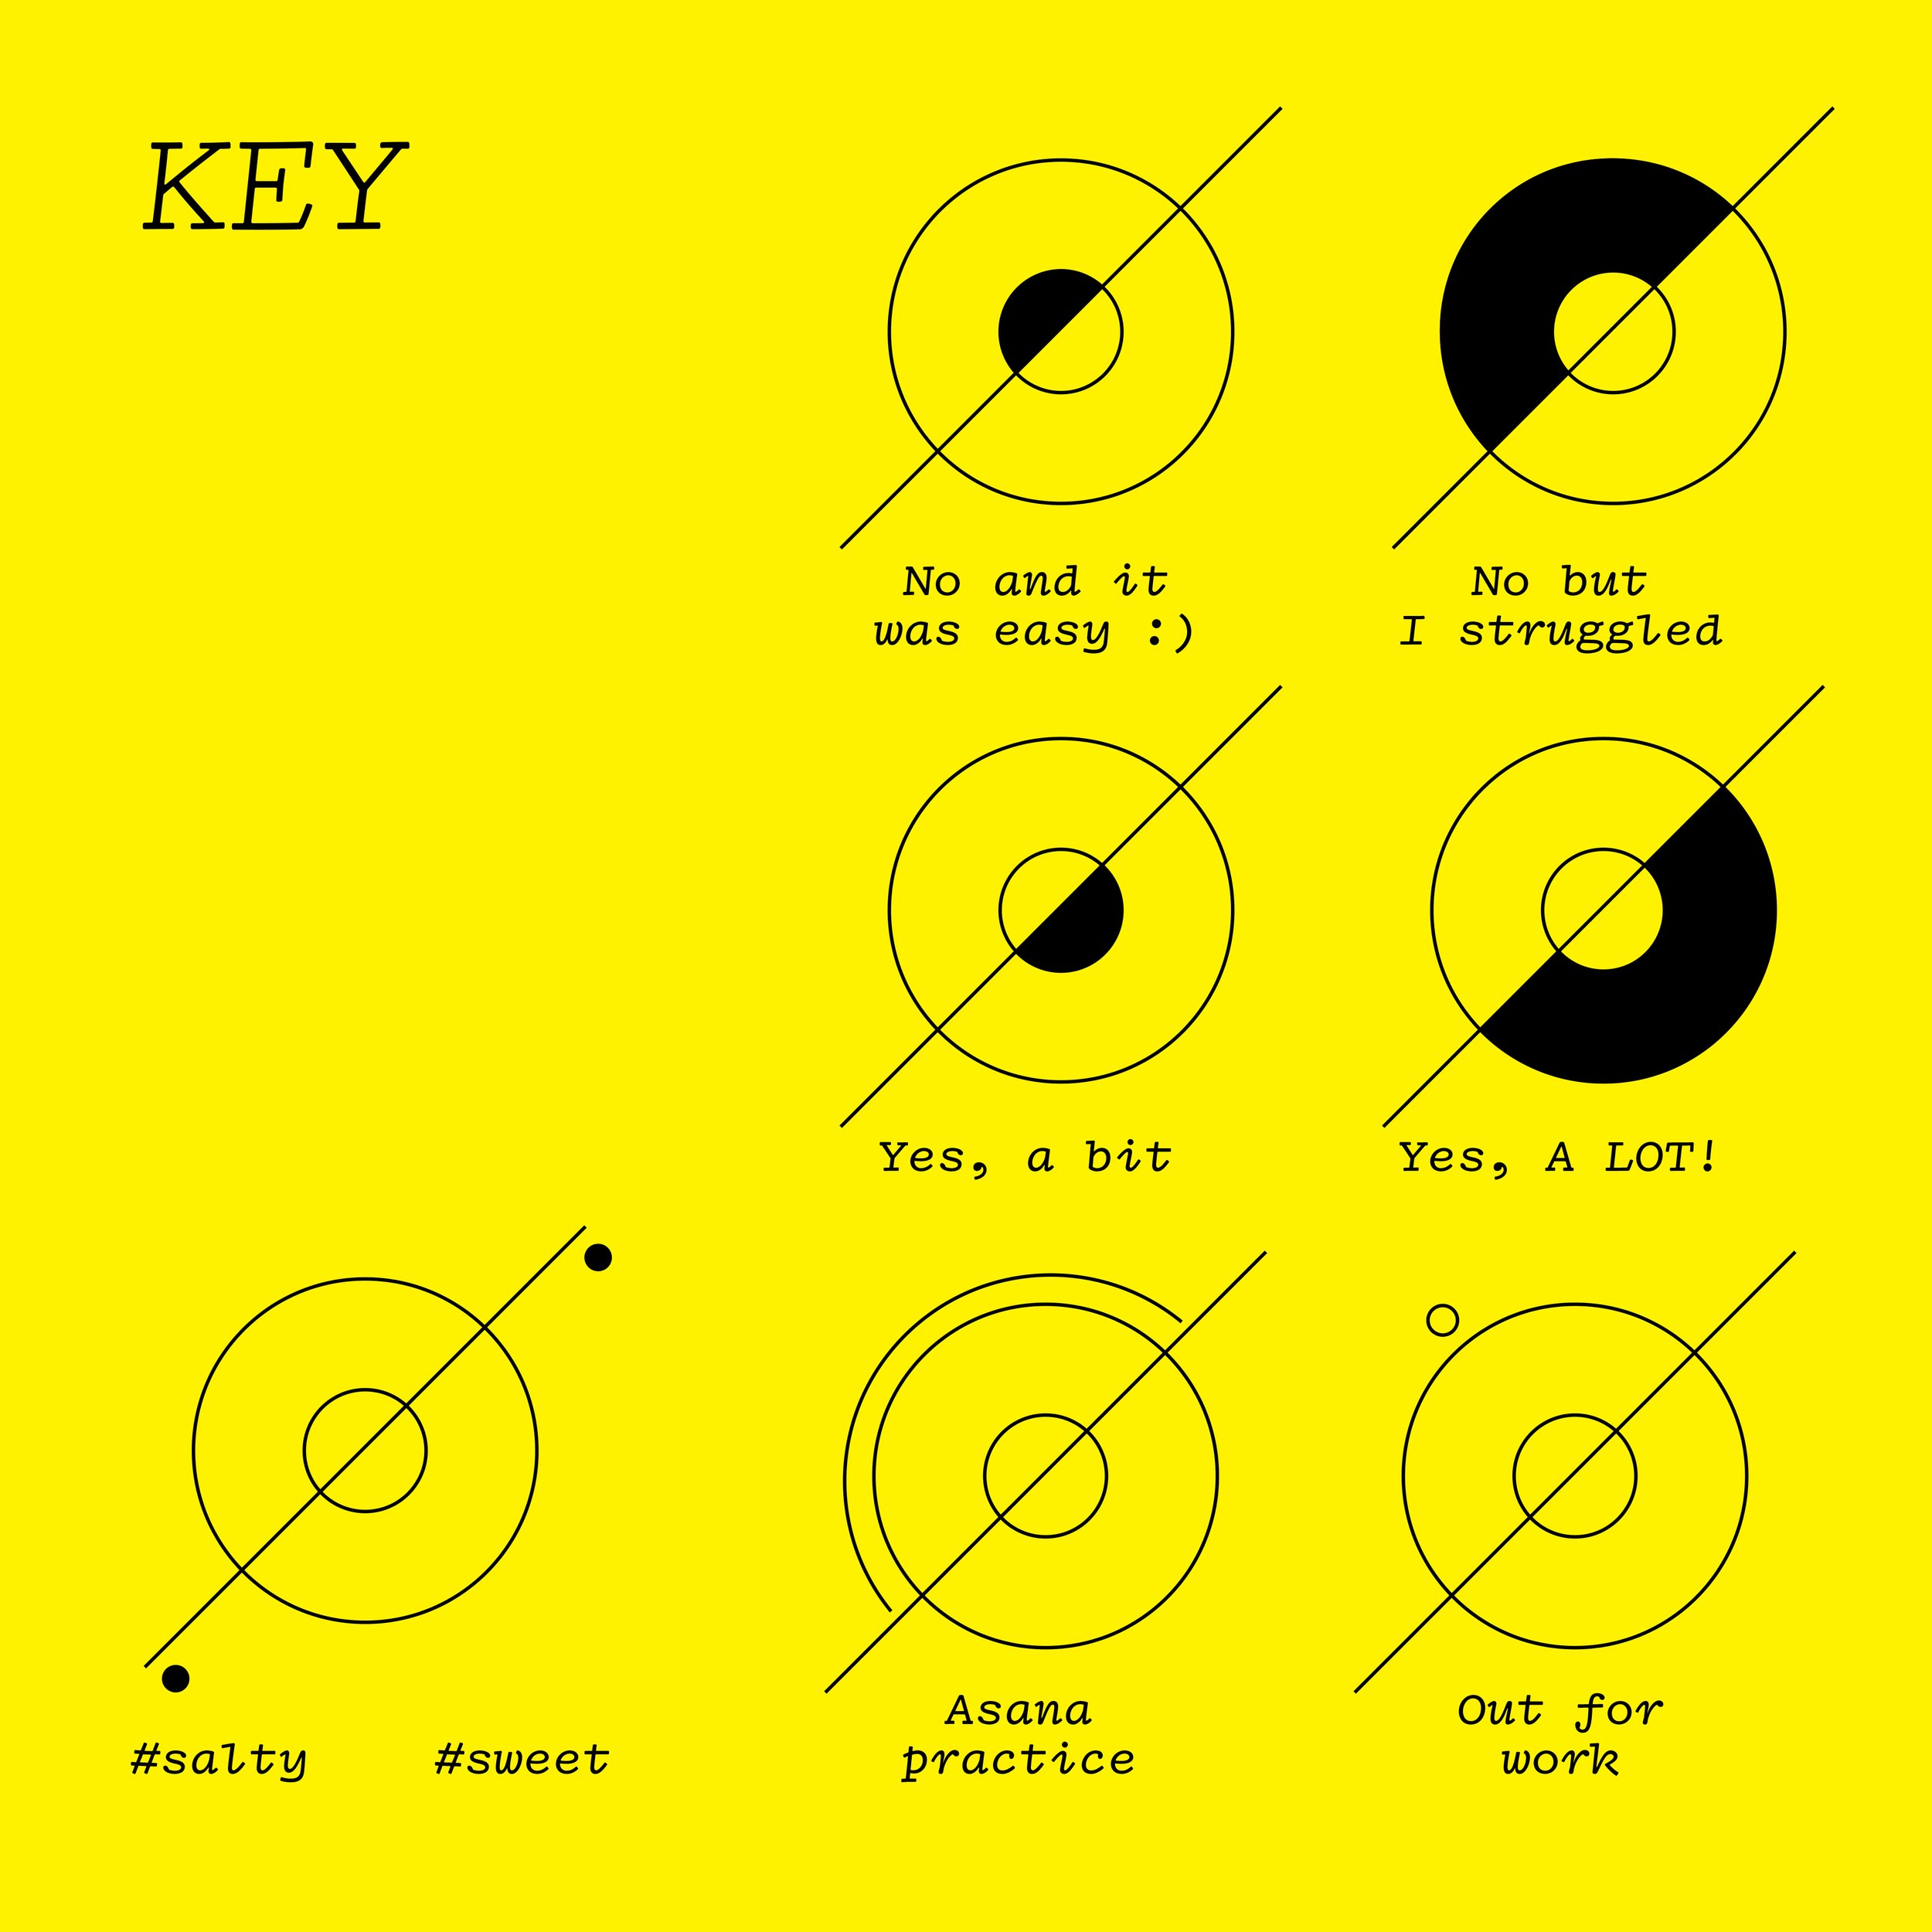
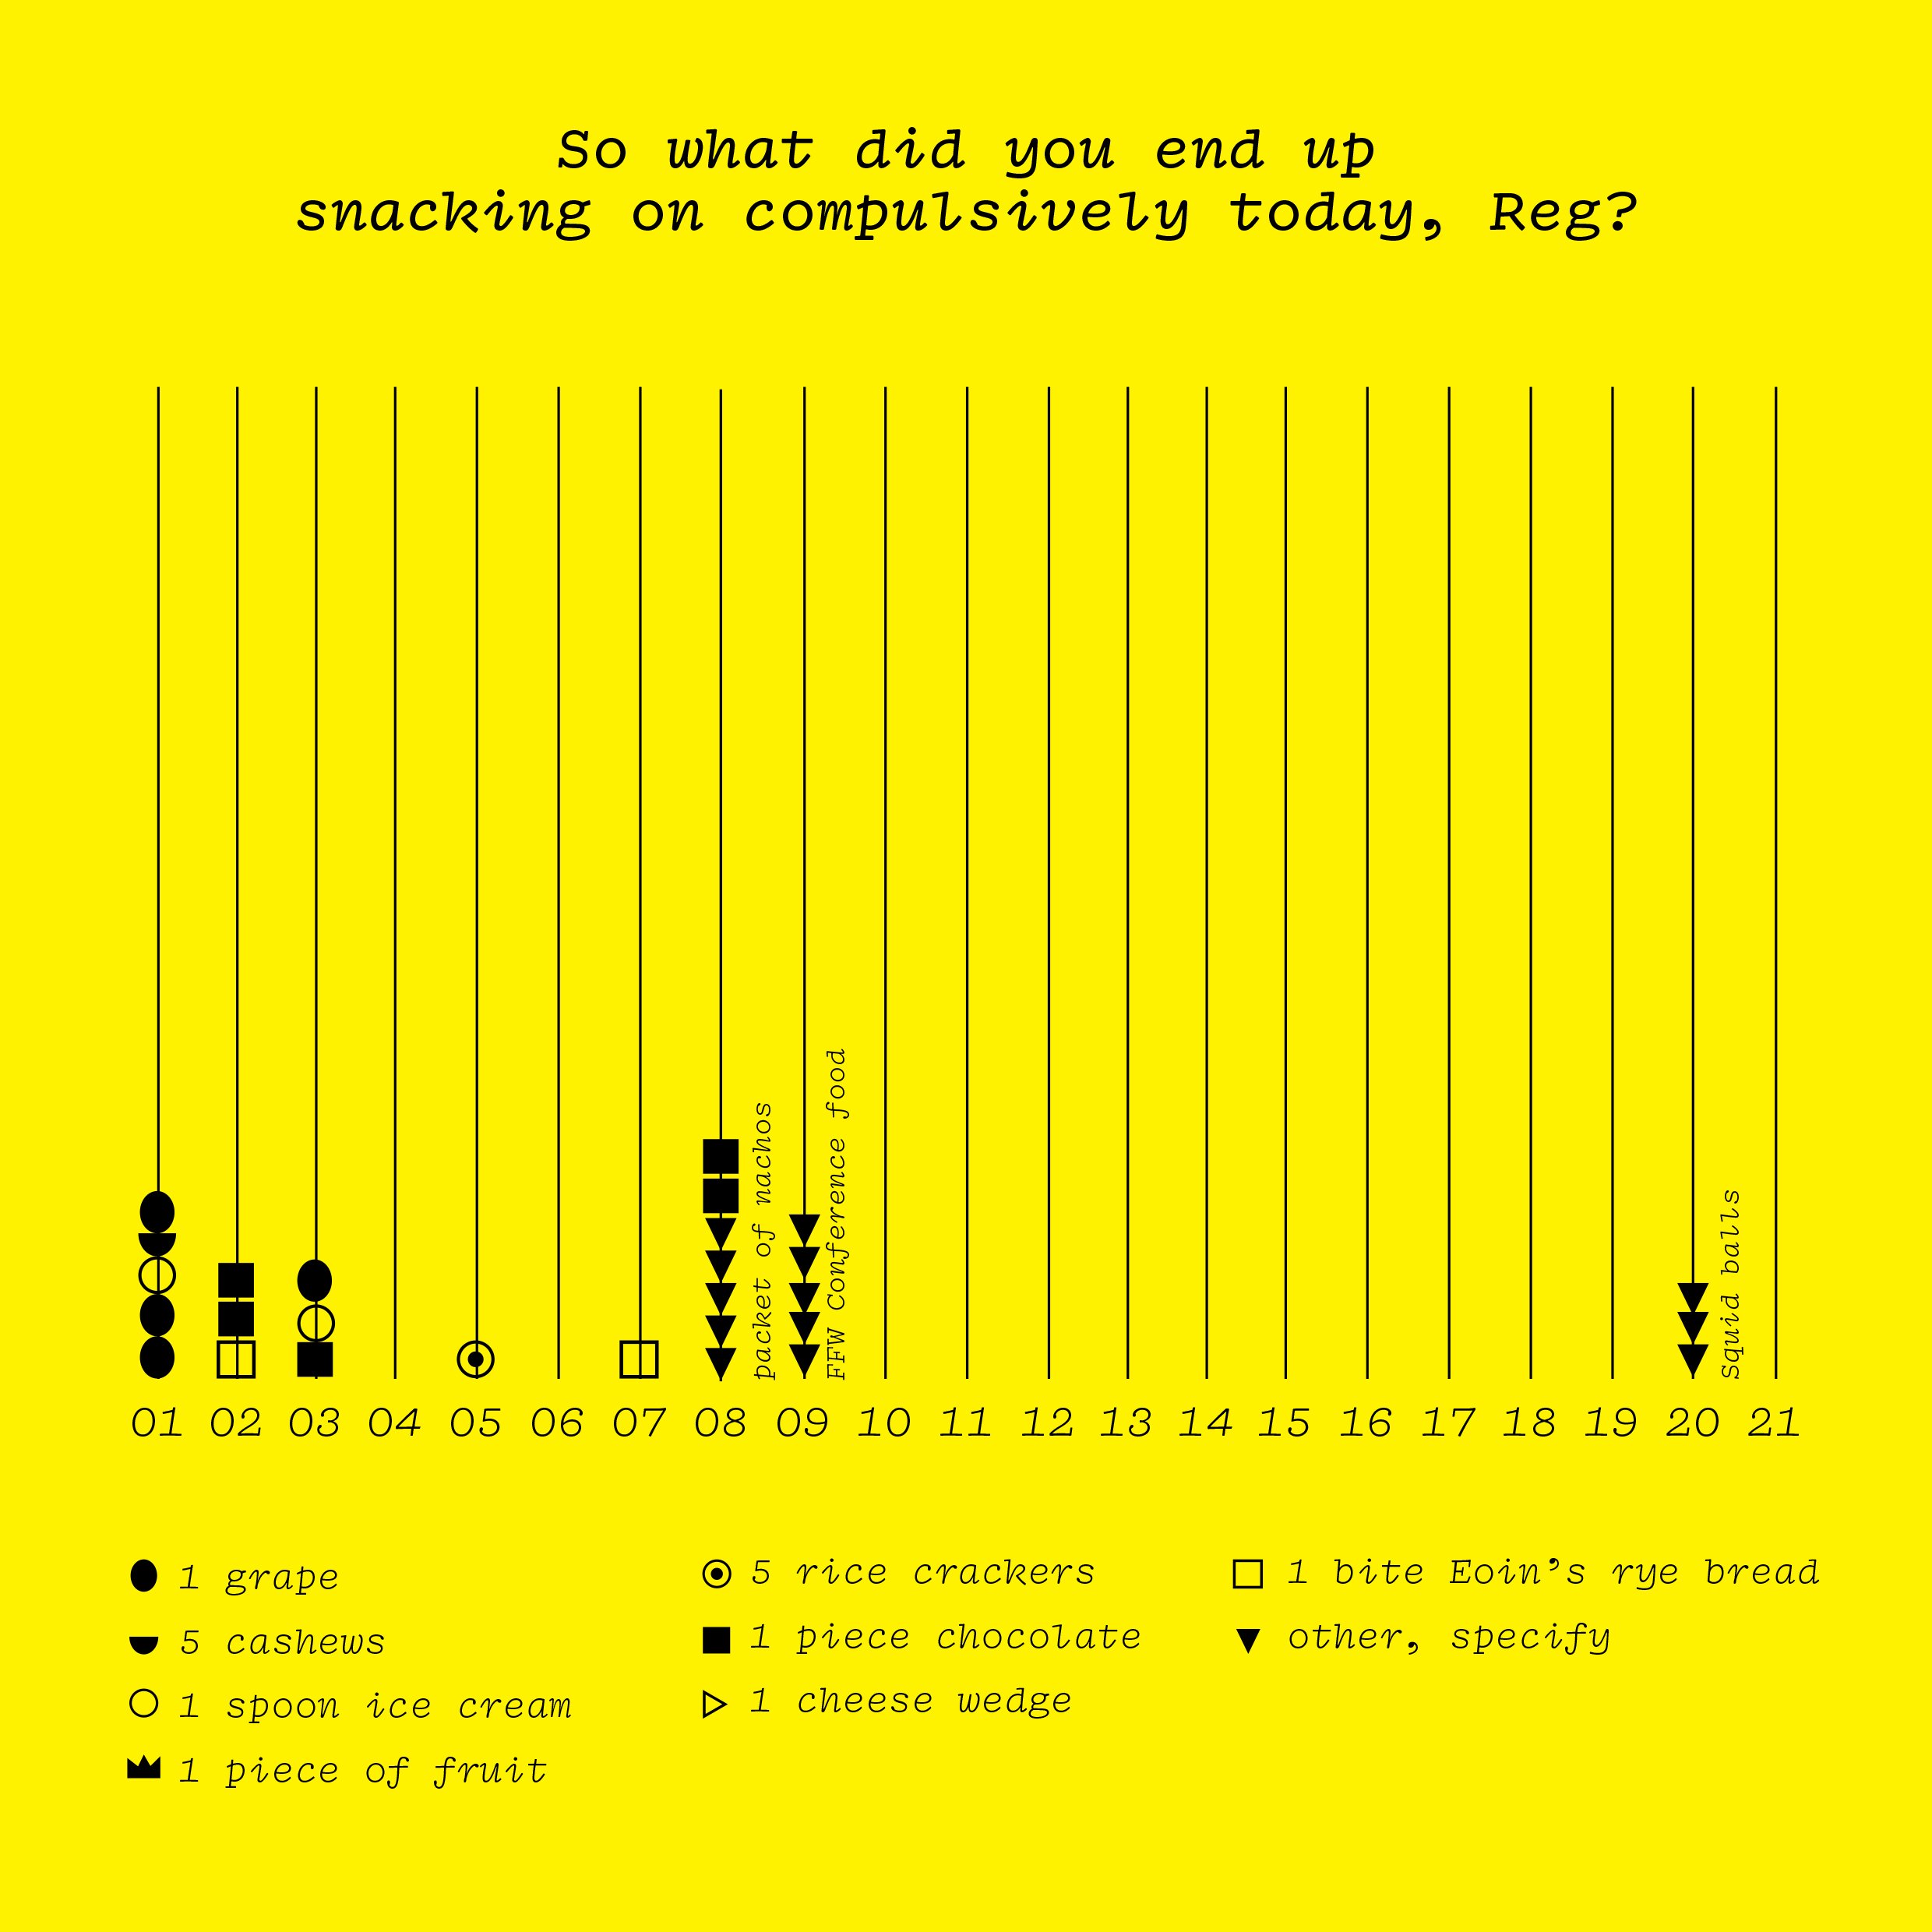
For the first three weeks, data on how often I snacked and what I snacked on was recorded with black pen on yellow card. But as the study went on, I found that what I snacked on didn’t really matter — it was the act of recording and the awareness of what I was doing that made me change my habits.
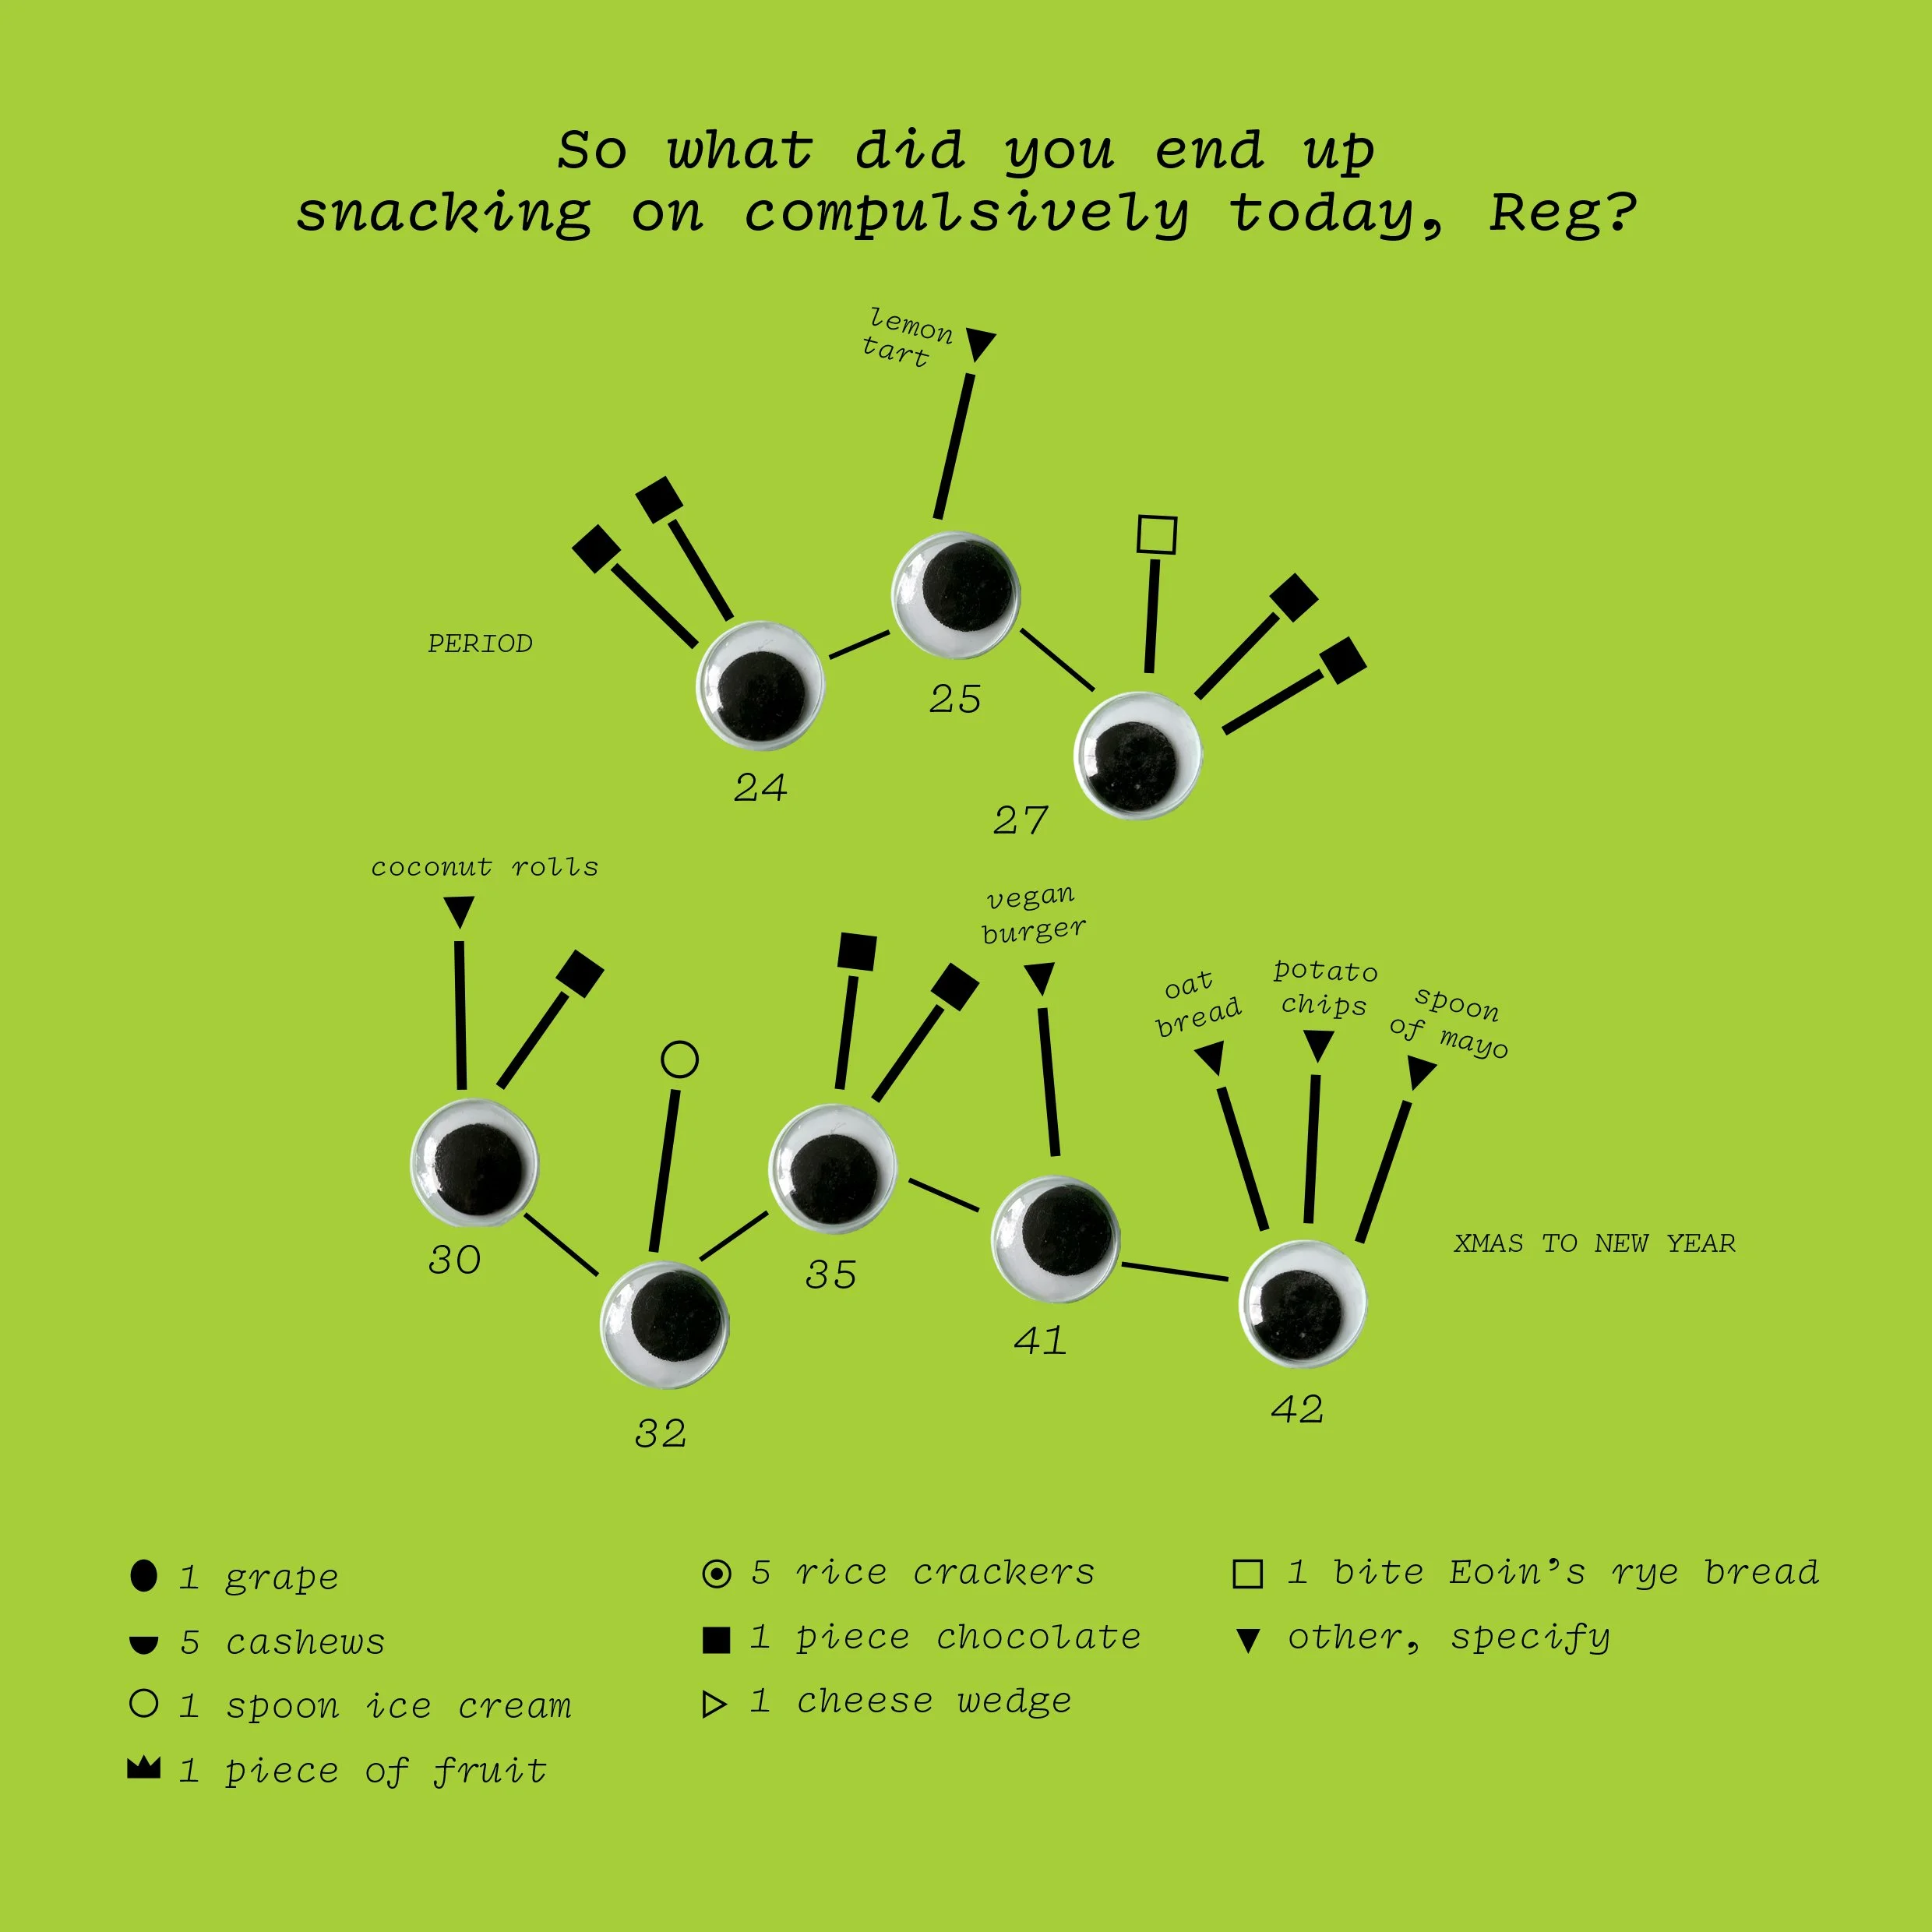
The recording method for Weeks 4 o 6 then switched to playful, familiar materials: googly eyes, black pen and green card. Using these materials calls into question the dominant modernist aesthetic of presenting data — must reliable data stories always be presented as bar graphs, pie charts, box plots and line graphs and be generated by software that requires specialist knowledge and skill? Using everyday physical materials creates space for vernacular contributions to data visualisation and reverses power structures by giving audiences a say in how they want data to be presented. It does not imply a less credible data story; it is simply a different formula, one more democratic, less imperialist.
This self-awareness brought about by visualising personal data also acts as a pre-requisite for agency: the capacity to understand one’s position critically and act accordingly, giving greater effectiveness to the action.
In the last three weeks, I tried to experiment with a method of recording that was non-linear, but found it difficult to come up with one that was both efficient and easy without being chronological. The resulting visualisation ended up being linear anyway.
The act of recording data in a physical, playful, ambiguous manner over a long period of time (9 weeks) was an engaging, reflective process and enabled me to knock a habit that I had been meaning to get rid of. I found that while the compulsive behaviour reduced within the first 3 weeks, the triggering effect of seeing snacks within reach didn’t fade until the last 3. What I snacked on compulsively or the reasons why I snacked compulsively also proved to be almost completely irrelevant. It was the lack of awareness and automaticity of the habit that I felt powerless over.